You won’t believe this. I didn’t, and I’ve spent more than a decade staring at airline industry data, so maybe I’m the only one who didn’t see it coming. I’m going to show you something that runs counter to conventional wisdom and what we know and hear about at every ACTE conference or GBTA convention.
It’s well known that airlines operate on lean margins. They lose a lot of money during recessions and only break into double digit profits during the more profitable second and third quarters, but rarely on an annual basis. As airlines continue to squeeze more revenue from every seat the average load factors have increased to the point that the summer surge isn’t even noticeable. Airlines combine the 100% achieved on Sunday’s, Mondays, Thursdays, and Friday’s with the low 80’s on Tuesday, Wednesday and Saturday to achieve an 88% load factor for the month. Any hiccup or foul weather leads to hours of delays since there are so few spare seats to accommodate stranded passengers. Strong finance organizations are required to manage the complicated flows of people and capital. Young airlines act as if marketing will be in charge forever, but losses and maturity have a way of sobering investors, and eventually the CFO will take over.
Prior to deregulation in 1978, the Civil Aviation Board (CAB) approved routes, frequencies and pricing. The government intervention created monopolies that allowed airlines to provide the white glove service and fine dining that so many people describe as the golden age of air travel. This was a time when a 50% load factor was profitable and it was acceptable to smoke from takeoff to touchdown. Filet was served on china and accompanied with real silverware. So which competitor exhibits this kind of pricing power today? Legacy carriers? The “low cost carriers?”
Every time Spirit, Jetblue, Southwest or Virgin America enter a market the local press wave banners announcing that low fares have finally arrived in Madison, Longview, or Springfield. How do they know?
The CAB reporting structure survived deregulation and data is still required monthly to be reported to the Department of Transportation on Form 41. Every US carrier with scheduled operations and revenue greater than one billion dollars must submit the form. It contains detailed information about the carrier’s financials and operating statistics. The data provides a rich view about how the airlines operate their equipment and move passengers and cargo between every city pair they serve. Here’s a link that describes the available data sets. You can create your own reports here.
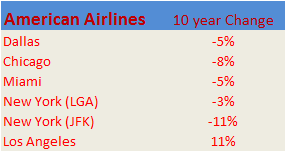
A table I found recently was particularly interesting since it contained information about average departure airfares, taxes and fees for passengers departing the top 100 US airports. Since this table doesn’t distinguish between International and Domestic traffic it would be difficult to support meaningful decisions with this – this is not a comprehensive variance analysis, it’s just a back of the envelope look at four or five major airlines, so you should be cautious about using my conclusions to support your decisions. There is one section that contains information that looked meaningful – a comparison between average fares from 2001 and 2011. Out of curiosity I looked at the price changes for American’s hubs. Most showed a decrease – not too surprising given their financial condition. The data is in the table below (all tables are from BTS 3rd quarter 2011 vs 3Q 2001 – click the link above for the most recent values).
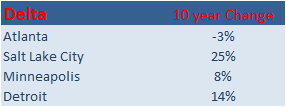
Next I moved on to Delta’s hubs. They have a fortress hub in Atlanta (under pressure from several LCC’s), but their operations in Salt Lake City, Detroit, and Minneapolis are stronger. Overall a mixed result but they’ve demonstrated more staying power than American. How did that compare to United’s operations in Denver, San Francisco, Washington? Little to brag about here; see the charts below for details.
Here’s United (includes Continental – Houston and Newark).

It’s remarkable that Houston Bush was up 12% in a city that hosts a Southwest hub. Meanwhile Newark was up 1% in an extremely competitive metro area. Continental should be applauded for holding their own, especially when the Dallas Fort Worth area offers Continental a pure play to compare against (favorably). American hosts their fortress hub at DFW, while Southwest occupies Dallas Love Field, a situation very close to Houston, yet DFW average fares are down 5% while Houston Bush is up 12%. That’s a big difference in a business that counts margin in basis points. Who has pricing power? It’s not American or United in Chicago; and prices in Denver and San Francisco should scare any competitor away.
Southwest. Industry professionals describe them as the quintessential low cost carrier. This is a company that is proud of their small sales force, doesn’t allow seat assignments and only offers one cabin, and they’re pricing champions.
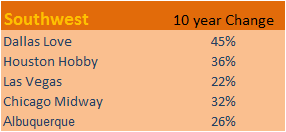
Those are impressive results. The next time someone excludes Southwest from a list of industry leaders, remember, driving revenue is one of only two ways to increase profits (Profit=Revenue-Cost), and Southwest is terrific at growing revenue.

Love the blog!
Thanks Amy – it’s been a lot of fun!
Most impressive!
Good stuff!
Thanks Tina! It’s been an interesting journey.