Why I’m Cheering For Uber

I landed at Heathrow at 10PM and needed a ride to the airport Sheraton on Bath road. My phone was acting up so I wasn’t able to use the Uber app that worked earlier that day in Qatar, and in the preceding days in Abu Dhabi, Brisbane, Los Angeles, and London. So I did what any road-weary traveler would do – I hailed a taxi. As the driver picked up my roll-aboard he looked at me and framed his demand as a question, “You’re paying cash right?”

What? Of course I am – I’ve been held captive by cabbie’s all over the world – and though I have tremendous respect for the most professional among them, the London Cabbies, I know better than to negotiate a credit card payment near midnight in the middle of nowhere (T4 is very quiet that late).

That four-mile drive lasted twenty minutes and cost my employer more than $30.

There are 400 airlines operating scheduled service around the globe, I don’t know how many hotel brands, or travel agencies exist, but ground transportation companies are part of a very fragmented industry. Until now.

I used four airlines to fly from Dallas, to Fiji, Australia, the United Arab Emirates, Qatar, and back to Dallas via London. The Western shore of Nadi, Fiji was the only place I couldn’t find Uber.

I’m not surprised by the polarized reaction discussions about Uber generate among travel managers. It’s hard to grasp how many problems Uber solved for globe-trotters and urban dwellers alike unless you’ve lived through it.

1. I can see where my car on the map in the Uber app before I request one.

2. I know the driver’s name and have his license plate before he arrives.

3. I can watch my journey in real-time on my phone while we travel to my destination – an address that I frequently plug-in before Uber arrives – which eliminates the three-minute discussion about where I’m headed and how to get there after the meter starts.

4. I get out of the car when I arrive at my destination. There’s no transaction or payment to the driver… no more lost cellphones or wallets because they’re safely tucked away before the driver pulled up to the curb. No more searches in his trunk to find those ancient multi-page slider-style receipts and listen to griping about how I needed to pay cash while he acts like it’s been months since anyone gave him a credit card.

5.  No more brake-stompers, tail-gators, loud-music listening, cellphone talking, A**hole drivers who act like they’re doing you a favor. You know what I mean if you’ve ever taken a cab between La Guardia and Midtown. Because I get to rate the driver after every trip. And if enough of his customers think he lacks the manners or skills to get us to our destination safely his ratings will plunge and Uber will cut him loose. How many taxi companies use customer ratings to do that?

Guess what? Uber driver’s rate their passengers too – and I care about my score – because if I ever need a ride out of a rough part of town at three in the morning I know someone will already know I’m a decent human-being and pick me up while the drunks and suckers have to hail a cab.

I know – Uber doesn’t blah, blah, blah, insurance, blah, blah, blah… well, I’ve jumped out of airplanes from 1,000′ without a camera and it wasn’t to enjoy the freefall, and I’ve flown airplanes upside down. I spent a few years as a first-responder too – I don’t care about insurance – that’s a check to give survivors. I care about safety. Have you seen the car Bob Simon was riding in when he died?  Here it is – the driver survived. I haven’t seen the full accident report, but early indications are that Bob was in the back and wasn’t wearing his seat belt.

If you really want your travelers to be safe tell them to buckle-up and only accept rides from Uber drivers with a 4.7+ rating.

Please hit “Like” and share this if you found it helpful.

Paul’s talk – “Personal Branding and Digital Footprints” is a discussion about how people connect, learn, and grow. He introduces ideas and techniques you can apply to achieve your goals, enhance your career, and help other people along the way.

Paul Laherty leads Deloitte’s relationship with several major airlines. Over the past fifteen years he’s led teams in Sales, Marketing, and Finance at American Airlines, Advito, Travelocity, Diio, and Cornerstone Information Systems. Paul’s an instrument-rated pilot, writer, speaker, world-traveler, former Army Officer, a husband, and father.  He helps people and organizations achieve significance, travel safely, and think differently. Paul publishes at paullaherty.com, and is open to connecting on LinkedIn at LinkedIn/paullaherty, or twitter @paul_laherty.

Aviation Risk Management Travel Management Trip Reports

Calculating Aircraft CO2 Emissions

How much carbon dioxide does an airplane create? Here’s the equation: 2 C8H18 + 25 O2 -> 16 CO2 +18 H20. Each gallon of JP8 – Kerosene – or jet fuel, weighs about 6.5 pounds. A gallon will combine with 23 pounds of Oxygen and generate twenty pounds of CO2. In practical terms wide-body flights on long haul routes will generate their take-off weight in Carbon Dioxide.

Here’s the detail. First, jet fuel, or Jet A, or JP8, contains a blend of different carbon-based molecules that combine with Oxygen to generate heat and pressure that jet engines convert to thrust. For simplicity, I’ll ignore the blend, and assume that “Octane”, a string-like molecule that contains a backbone with eight carbon atoms and eighteen Hydrogen atoms along the sides and endcaps, is a good proxy for everything else in the gas tank. During the combustion reaction, each carbon atom will combine with two Oxygen atoms to form Carbon Dioxide (CO2), while the Hydrogen will also combine with Oxygen, but their marriage yields water (H20). The reaction balances when two Octane molecules react with twenty-five Oxygen molecules (O2) which contain two Oxygen atoms. The exhaust product contains sixteen Carbon Dioxide molecules and eighteen water molecules. Here’s the equation again: 2 C8H18 + 25 O2 -> 16 CO2 +18 H20.

This detail isn’t useful until we convert molecular weights and ratios into terms that people are more familiar with. We know jet fuel weighs about 6.5lbs per gallon, and that mass is 81% carbon. We already know that our Octane molecule will split to form water and CO2, but the result most people struggle with is the conversion to weight. Specifically, Oxygen is heavy, about a third heavier than Carbon, so when each Carbon atom combines with two Oxygen atoms, the resulting molecule, CO2 is four times heavier than the Carbon atom by itself. This means each gallon of jet fuel (6.5lbs) will combine with 23lbs of Oxygen and turn into twenty pounds of CO2, and just over nine pounds of water!

How much CO2 does a Boeing 777-200 create on a flight between Chicago and Hong Kong? Let’s work through it – fuel is a liquid, and measured in gallons, but the exhaust is a gas, that’s why we use weight rather than volume to describe the output. I calculated the 777-200’s gas mileage in a previous post that compared a Boeing 737 against a Toyota Prius. At .1836 miles per gallon, a 7,821 mile flight needs 42,000 gallons. The flight would generate 851,000lbs of CO2. That’s 30% more than the maximum takeoff weight on departure, including the plane, fuel, passengers and cargo. The table below contains a comparison among cabins and shows passengers, fuel burn and CO2 emissions.

CO2 per flight

Now that you have information about how to calculate the CO2 emissions for an entire flight, we need to add more information to break this down to the seat level. Previously I calculated the fuel burn per seat to provide a table that shows how much the fuel costs per mile for each cabin and at various price points for fuel. That’s a good starting point, but this time the data table will display how much CO2 an international flight would create for different distances and cabin. See below.

C02 per seat 777-200

The Boeing 777-200 offers a useful snapshot of the likely performance other aircraft could achieve. It’s a good benchmark because it’s currently in production and it’s flown on transatlantic, transpacific and intra-Asia flights.  However, the design requirements for long-haul international flying require twin aisles, more lavatories, large galleys, more storage space, life rafts and a host of other overhead not needed for shorter hops. These factors make it useful to perform a similar calculation to offer information about CO2 production from more efficient single aisle aircraft in use on short hauls and for domestic US flying. In this case, the 189 seat, all coach, 737-800.

CO2 per flight 737

A comparison between the 737 and 777 coach emissions levels demonstrate that the smaller aircraft is more than 55% more fuel efficient when using numbers normalized for total seats. When you measure efficiency on a blended basis across all cabins the total difference is higher, that’s why it’s important to have separate tables. These tables offer you a quick resource to answer questions about the carbon footprint your travelers leave behind each trip.

Aviation

Knock the Rust Off IFR Approaches

IMC approach

For the pilots out there – this is a note to myself that I’ll use to “knock the rust off” the next time I have a layoff between flying IFR approaches in my local area. I just earned my IFR rating, but my flying occured in three periods, with six to nine month delays between each. Instrument Flight Rules flying requires good techniques and creates a high workload for single pilot operations. I found myself “relearning” each time – it was especially frustrating since I had mastered flying a stable final approach twice before. This list constitutes heuristics and guidelines for me to become proficient again quickly.  WARNING: I am not a flight instructor or a commercial pilot – just a private pilot who met the FAA standards to earn an IFR rating – so this may be wrong or not applicable to your situation and airplane.

Prepare for IFR flight:

  1. During preflight, setup NAVCOM radios for your approach.
  2. Call clearance delivery for a clearance. Follow the CRAFT format: Cleared to; Right after departure; Altitude; Frequency; Transponder
  3. Set altitude for departure airport, and adjust DG, AI for flight. Check-in with the local VOR/DME to verify VOR equipment operational.
  4. Set tower frequency as soon as you reach the departure end of runway before performing the pre-departure checklist.
  5. Once airborne, tune-in arrival weather, and reset altimeter as necessary.
  6. Before vectors to approach course, verify navigation aid by listening to the identifiers broadcast from the aid. Press the Nav 1 or Nav 2 button to listen, and turn up the volume on the Navigation radio to hear it.
  7. In straight, level, cruise-flight reset the DG to match the compass before ATC provides vectors.
  8. ATC will give you a vector that will put you on the final course – you must watch the needle when you make the final turn to capture the localizer.
  9. Verify minimum altitude prior to the Outer-Marker and brief the Final Approach Fix, altitudes and missed approach procedures.
  10. At the Outer-Marker power back and pitch down for a 500′ – 700′ FPM descent. The power setting is critical – too high, and the aircraft will not descend easily and need a lot of left rudder to remain on course. Use an initial power setting at 2150-2200 RPM’s for best effect. It’s much easier to flatten-out to recapture the glideslope, than to be too high above it… so power setting at the Outer-Marker at the correct “initial” altitude is the key to have a fighting chance at a low-workload approach.
  11. Instrument scan during the approach is the next battle – once a 500′ descent rate is established and the aircraft is aligned with the localizer, use left rudder to keep the Directional Gyro (DG) from turning, and use the Attitude Indicator (AI) and wing-leveler or Turn Coordinator (TC) to keep the wings level. Engine power, and nose-down attitude make the glideslope a non-event. Now – no matter how rough the air – keep the wings level with constant monitoring. Once the aircraft gets slightly off course, 3 degree corrections are the ONLY acceptable response. Use the localizer to verify position relative to the runway, and ensure wings are level. As you drift away from the localizer, make slight adjustments to recapture (let the wings turn towards your course, verify new course with the DG, and return to wings level) and verify or confirm progress using the localizer – alternatively, use the localizer indicated on the GPS to verify position relative to the centerline, but only use slight wing dips away from level to return to course.
  12. Your scan must be lightening-fast in the last 90 seconds before the touchdown point. Focus on keeping your wings level… and glance at the localizer to confirm you’re in the right spot, while looks at the Vertical Speed Indicator (VSI) allow corrections for altitude. In rough air you need to monitor the VSI more frequently to compensate for updrafts and downdraft effects. Downdrafts that require higher power settings are especially difficult since they increase workload. You need vigiliance and rudder inputs to keep the aircraft from turning. Once the desired altitude is achieved, re-establish the lower power setting and pitch down to maintain 500 FPM.
  13. Keys to a stable approach – persistence – use a rapid scan, and don’t give up: Reach the Outer-Marker aligned with the localizer and know the approach heading you must maintain on the DG, cross at the right altitude, immediately establish pitch and power for a descent rate, apply slight left rudder and keep the wings level.
  14. Go-arounds at the bottom require: 1. Full power; 2. Pitch up to 10 degrees nose up (use AI), and verify climb with a look at the VSI (This is the hardest step, since you will feel like you’re tumbling backwards – trust the AI, VSI, and Airspeed); 3. Apply right rudder as necessary for coordinated flight.

Have fun and let me know if you found this helpful.

Aviation

How Great Airlines Treat VIP’s

Several months ago a friend asked me to create a framework for a major airline’s Entertainment Desk to service Los Angeles-based movie studios and television networks. I had a few ideas – but first the background:

Transcon: The JFK<>LAX market is the most important air market in North America. Five airlines carry >11,000 passengers between these cities each day and host celebrities, bankers, tourists and high net worth travelers on sixty-four non-stop departures (thirty-two per airport). American dominates the market with the largest aircraft and highest frequency. They operate ageing twin-aisle 767-200’s with a three-class configuration and International Flagship Service. United caters to the same crowd and operates with more efficient three-class 757’s, while Delta, Jetblue and Virgin America offer two cabins on a mix of 737’s/A320’s.

Historically movie studio’s and other entertainment customers selected American or United as their primary carrier in this market since creative talent and executives are allowed to fly in the forward cabin (why pick a two-class aircraft when three-class is offered?) These corporate customers routinely achieved >90% share in the transcon market. More recently, Delta enhanced their two-class product to include a lie-flat International business-class seat and increased to seven daily frequencies while United pulled back to six. This competitive action has re-ordered the Transcon marketplace and Studio travel managers tell me that travelers prefer Delta’s Premium cabin to AA’s out-dated 767’s and United 757’s.

Delta’s progress may slow soon. United is rolling out a new product now, while American announced new three-class A321’s will roll out in January 2014, to replace their current product. This upgrade includes lie-flat seats in first and business-class. JetBlue also jumped-in and plans to launch A321 service in 2Q ’14, that will include private pods in first-class. Before it’s even started, 2014 is shaping up to be a disruptive year for the Transcon market.

The Desk: Superior airlines also compete on the ground and offer services tailored to their best customers. The Entertainment Desk is dedicated to a very specific group of clients, and should make a market in first-class seats between New York, London, Miami, and Los Angeles or offer access to private jets where feasible. The desk exists to expedite difficult and unusual requests. The Entertainment Manager facilitates requests to seat Talent, their Agents, Studio or Network Management, Publicists and others with the Talent – or create a plausible denial when discretion requires it. This function is not a discount mechanism to clear waitlists and upgrades – Airlines must offer a high-touch, guaranteed service.

Winning airlines create hope during every crisis – airlines should move mountains to support their customers. Clients should believe their Airline’s Entertainment Team will do everything possible to fix the problem or propose alternatives that will improve it materially. This group is not motivated by money or cost – service matters. The George Lucas expression – “do or do not, there is no try” applies. An Entertainment Desk is an airline’s service ER. Employees must be able to reach into a PNR to grab a torn artery – when the Entertainment Desk calls premium services at LAX, JFK, MIA or LHR, the response should not be, “Who is this?” Rather, “What can I do for you RIGHT NOW?”

Examples: Airline’s will solve requests like this on a daily basis: NBC called since Alec Baldwin’s Assistant booked late and needs the seat right next to him for his publicist or agent. The Entertainment team will call Sony, or Paramount or Fox, or AMEX or the owner of that seat to get it done – or suggest moving both of them to a pair of seats that are available. Great airlines block First-class in the transcon market one week each May to allow studios to grab space to attend the “Upfronts.” They empower their team. No one should recite policies designed for 99% of the 250K travelers you handle every day. Accept that these are special customers and start from that assumption. The team should be “accessible” 24/7 via cell and have GDS access from home. They’ll only receive 10-15 emergency, after-hours, calls per year… but it’s a gesture that sets winning airlines apart from their peers.

The Entertainment Manager must have an exceptional relationship with the airline’s premium service managers in LA, New York, London, Miami and Nashville, and should be known across your system and alliance – and that means they need to be included in global premium service meetings and updates when you have them. This person must be available at all times and have a back-up who can assign seats or clear space. Overbooking capabilities are recommended.

Entertainment Managers must be quick to challenge requests and propose alternatives when operational hurdles prevent the studio request from being granted as requested. A “customer focused” attitude should be real; once a carrier earns a customer’s trust and loyalty they will choose that vendor every time. In those rare cases when the carrier “burns” their customer – the most senior executive available should issue a mea culpa, in-person, and a offer a range of options to fix whatever it is they didn’t solve three days earlier.

Additional examples to work through now: On one flight the President of a network was removed to accommodate a Federal Air Marshal, while two subordinates, both top-tier frequent flyers were left on the flight. Revenue Management based their decision on the customer’s lack of a frequent flyer number. The customer didn’t have one for two reasons: 1. Security – to maintain anonymity; 2. She was authorized to fly private and rarely flew commercial  (the plane was not available that day). In this case the General Manager intervened and found a seat, but you can see how an airline’s policies are not designed around premium travelers in marginal cases. Airlines service customers who fly to NY Commercially, then to Miami by private jet, before they will discover that their MIA->LAX segment was cancelled because they no-showed the LGA->MIA flight. Great airlines step-up to fix it when a VIP is standing at the ticket-counter and flights are oversold all day.

This desk also makes “meet and greets” happen (not ‘space available’, they make it happen) and they treat airport assistance companies as valued partners. Great airlines speak in guarantees. This is hard for commercial airline managers to do, but it’s necessary to win. Great airlines are discrete – they don’t tolerate employees who call TMZ or tip-off the paparrazi. This desk can call flight ops and ask the Chief Pilot to introduce himself to the guest in 3A and to ask the VIP passenger if there’s anything they need. This desk says, “Sure, I’ll approve your oversize, outrageous pet in first-class (at the window), as long as the handler is seated next to it” No discount…this isn’t a discount desk – service focused. This person will need LHR to clear a closet in First Class on a 777 to accommodate the CEO’s spouse’s Cello. And you will need authority to offer 150,000 miles for an apology without advance approval.

Finally, I recommend a $100,000 TAC budget to invite agents and managers to take one or two trips annually to London or New York (and a thorough understanding of the Foreign Corrupt Services Act to keep you out of trouble). When offered a chance to show off your product – do. This isn’t a discount crowd, so treat them accordingly.

There’s more, but airlines that empower their teams with “authority and resources” to do anything the FAA, TSA, DOJ, and the DOT allow, to take care of their best customers, will have unlimited success.

Aviation Sales & Marketing Travel Management

Celebrating “Gus” Kaminski on Veterans’ Day

Robert Andrew “Gus” Kaminski, US Navy SEAL, and Commander of the US NAVY Leapfrogs.

I knew Gus and many of you saw him in action – an anonymous actor who jumped into a stadium or super-speedway to launch a great event. I was very sorry to hear that he passed away.

Gus was Alpha-500, my battle-buddy at Airborne school. We met in September, 1995, right before I moved to Korea. I was Alpha-501, the second senior student by date of rank. Gus had graduated from the Naval Academy the year before and had just finished his SEAL training. He needed to complete the Army’s basic airborne course before assignment to his first operational team.

Gus was a character – and he knew it. He had a highly developed sense of humor and perfect timing. Gus was also a physical specimen. He could do fifty consecutive one-armed pull-ups. This brought a lot of pain for me. Gus would mouth off to the Blackhats (Airborne Instructors) regularly so the rest of us spent a lot of time in the front-leaning-rest to pay for his sins. I remember vividly that my face hurt from laughing more than my arms did.

He led the way, but wasn’t the only one who would rib our instructors. Anytime Gus would take a break, Second Lieutenant Pendergast, from the Oregon National Guard, Alpha-503, and a recent Ranger school graduate, would shout, “I’d rather be a Leg-Ranger than a Tabless Airborne!” This insulted our Blackhats who would tear into a rage every time Pendergast said it.

We were bruised, tired, and happy in the 100 degree heat – Hurricane Opel had just trashed Fort Benning and we were covered in Georgia sand, pine needles, tics, sweat, dust, and god knows what else. Gus wasn’t even winded when he started yelling – “You can’t smoke a rock”. That got ‘em fired up again – I was between the two of them trying to get air between laughing and doing pushups. Now it’s my turn so the Blackhats are yelling at me (for laughing). Apparently I wasn’t taking my Airborne training seriously, that’s when Gus changed his tune again to “You can’t smoke a quitter.”

I was living through a moment I knew I would remember forever. Unbelievably I followed him out the door on his first jump. Kaminski is still the toughest guy I’ve ever known and one of the happiest. Although we never spoke again I enjoyed knowing him – and I’m confident there’s an entire country that will miss Gus. You can learn more here.

Aviation Coaching

China Southern Airlines A380 flight to Guangzhou

Guangzhou China December 8, 21012 018

China Southern Airline Company invited me to attend their 2012 partner conference in Auckland, New Zealand. This gave me a chance to learn more about Asia’s largest carrier and the world’s sixth largest. Conference participants were invited to connect via the new Baiyun International Airport (CAN) in Guangzhou, China enroute to Auckland (AKL). Since my journey started in Dallas (DFW), I transferred to China Southern’s daily Airbus A380 service from Los Angeles. This gave me time to explore their new plane and three days in Guangzhou and the Pearl Hotel (owned by the airline and available to passengers with tickets in Business Class and First Class on International flights).

The short notice required a call to CIBT Visa services to add pages to my passport at the US State Department’s processing center in Miami, then on to the Chinese Consulate in Houston for a six month, multiple-entry, business visa to enter China and join the other delegates.

My American flight to LAX was uneventful, and the connection was long enough to visit the Admiral’s Club at Terminal 4. I recharged, enjoyed the refreshments and updated the settings on my Iphone before the short walk to the Tom Bradley Terminal.  The International Terminal at LAX is undergoing a renovation, but still provides a convenient connection from the domestic terminals. Once past security travelers with lounge access will find a quiet atmosphere, inviting finger food and a well-stocked bar at the China Southern Airlines’ multi-airline lounge. After a quick look around it was clear that good weather and the additional jumbo-jet gates to handle A380’s and 747-800’s will maintain LAX’s position as one of the busiest airport in the world (6th) and North America’s favorite gateway to Asia.

The Airbus A380. An incredible airplane. Since all seventy, read Seven-Zero, business class seats are on the upper deck, you’re not faced with a simple, “which side of the plane are you sitting on” question from the flight crew. Before the gate staff release you to approach one of the three jet-bridges they asked if my seat was upstairs or downstairs? After climbing the ramp to a jet-bridge that led to the upper-deck I noticed the view over the Boeing 777 at the next gate. The fuselage is almost 28′ high and 34′ above ground level. It was a long way down from the doorway.

Flight to Auckland 001

The interior was well-designed. China Southern’s business class seats are very good. The 1-2-1 configuration offers aisle access to every seat and adequate privacy between seats. They’re staggered so the foot-well for the seat behind you is under your table and storage bins. The best seats are at the windows with a ‘table’ between the aisle and the seat, but even the least desirable seats were good. The fabric-trimmed seats are comfortable, and open to a level and flat position for sleeping. They provide lots of personal storage, power ports for different plugs and a USB cable, and a large LCD screen with an excellent movie selection (I spent sixty hours on-board over ten days and only made it through half the movies I wanted to watch). The amenity kits included all of the items you would expect to find: a toothbrush, toothpaste, mouthwash, comb, perfume, lotion, lip balm, earplugs, and an excellent eye-shade with two straps. They also provide a comfortable, two-piece, pair of dark blue cotton pajamas to size, trimmed in dark-red, and matching slippers. Many of the travelers in my cabin took advantage of them for the sixteen hour ride.

Onboard service was excellent – the menu included a mix of familiar Chinese and Western dishes offered in several courses that didn’t leave anyone hungry. Mid-flight snacks and beverages were available on request in the galley or self-service from the forward bar (yes – there is a bar, no lounge,  but a good selection of wines, liquor, fruit and chocolates). After the dinner service I descended the grand staircase to the forward cabin to start my self-guided tour. First stop, the superb First Class seats, actually very private ‘compartments’ in the nose on the lower deck. Next, three sections containing typical Coach Class 3-4-3 seating. The seats reclined well, but self-service snacks and personal LCD screens were competing for recognition as the most popular feature. Mission accomplished I climbed the spiral staircase in the tail and passed through the coach cabin on the upper deck before stopping in the business class galley for a snack before I started my next movie.

The Westbound flight arrived in Guangzhou on Saturday at 5AM local time two days after the midnight departure from LAX. It was strange to spend sixteen hours in the dark, but the long flight left me ready to tackle a tour in Guangzhou after clearing immigration and my morning check-in at the Pearl Hotel.

Baiyun International Airport – Shares features with other contemporary greenfield airports, its massive and well-designed. Passenger movement is easy and signage is clear. Open for only a few years they are already working on a third runway to increase capacity. There are dozens of shops and restaurants and every service you would expect to find in a major International hub. The modern Guangzhou Metro is located in the central terminal and downtown is accessible with luggage in tow.

The Guangzhou Metro rivals any of the smoothest, most comfortable subways in the world. The modern gates, new trains, continuously welded rail, and digital moving-maps displays in the cars combined to create a stress-free travel experience. People were friendly and courteous, but the trains did fill up later in the day, and service ended earlier than I was accustomed to especially compared to London, or New York schedules.

Guangzhou China December 9, 2012 010

Although Guangzhou is a large metropolitan area the new subway doesn’t have closely-spaced stations. I covered considerable distances by foot and used cabs to move between attractions in the city. Cabs were inexpensive, ten Yuan for the first 2.5km translated to roughly $2 for the first 1.5 miles. They didn’t charge extras for more passengers, but you should insist they start the meter once they’re moving. Additionally, I found that few drivers spoke English, so I frequently used a tourist map from my hotel to explain to drivers where I wanted to go.

Where to go. New Town, is an incredible collection of modern buildings, arenas and sporting venues with a large mall through the center (above and below ground). I found thousands of people everywhere I went, but New Town was a great place to start. When I finished there I took a train to the South side of the Pearl River to view the city from the Canton Tower. The tower was a great place for perspective on the enormous city. Next I took a cab to Beijing Road Shopping Mall for a quick look, then another cab to the Chen Family Temple Compound (Guangdong Folk Art Museum), and finally the Shangxiajiu Pedestrian Street in the Liwan district.

Flight to Auckland 007

Guangzhou China December 9, 2012 062


Guangzhou China December 9, 2012 061

Shangxiajiu Pedestrian Street above, and a shoe store in Liwan below.

Guangzhou China December 9, 2012 013

Guangzhou is one of the busiest retail cities in the world – it’s full of malls and markets and hosts several markets for corporate buyers throughout the year. There are entire streets dedicated to a single item – I found the belt street, framing shops, and several extensive jade markets. The back alley shops were the most interesting for me – I could have stayed a week to explore the neighborhood markets in Liwan. I did return the next day, and again the following weekend with several colleagues, but Sunday evening, I joined the China Southern Airlines Company delegation at the Pearl Hotel for our flight to New Zealand.

Guangzhou China December 9, 2012 023

A sidewalk restaurant a few blocks west of Beijing Road (above), and a jewelry-maker near the Jade Market North of the Shangxiajiu Pedestrian Street (below).

Guangzhou China December 9, 2012 068

In part 2 I’ll describe Auckland and the surrounding sites.

Aviation Trip Reports

Pick a winner – Yield beats Average Ticket Price

Winners play the odds. During a recent discussion with a friend of mine who is the Travel Manager for a large corporation we agreed that yield is a superior metric. Naturally the next topic was how do you explain it to people?

Simple – Yield is more flexible and offers more information faster.

Average Ticket Prices (ATP) should only be used to evaluate pricing or cost performance in a single market. Ticket prices can be used to compare airlines against one another in one Origin and Destination (O&D) market or for timescale comparisons on a route (y-o-y / qtr-o-qtr / m-o-m). Average Ticket Prices should not be used to compare aggregated markets. An example would be the average price between Boston and several European cities: London, Paris, Frankfurt. You could show the 2012 ATP is $2,300, while in 2011 it was $2,000 – a 15% increase, but you still need to break it down. What if the ATP is driven by increases in the London market, while the Frankfurt and Paris markets declined. On a absolute basis, the London flight might still be cheaper than the longer flights to Paris or Frankfurt. Average Ticket Price comparisons require more anchors – you need to be familiar with far more prices and it still doesn’t give you enough information to know if your preferred carriers are offering a good deal. In this case, the change (increase or decrease) is the meaningful number not the price.

Yield is superior to average ticket price because it allows meaningful comparisons between O&D’s of different lengths and it produces fewer decision errors when markets are grouped.  Yield is the primary metric PRISM users apply to market strategies since it  reduces the number of marginal flights when you’re evaluating a large data-set. Specifically, average ticket price (ATP) is very sensitive to context (cabin and distance), while yield is less sensitive to distance since the number is derived by dividing the ATP by the flight’s distance. In domestic terms once a sales manager removes East coast shuttle markets (the bulk of those marginal, yield-skewed flights), it’s much easier to build a US domestic to domestic term and assign reasonable share goals. Like ATP, Yield comparisons should be reported at the cabin level since there will be large differences across cabins.

An example. A yield comparison between Boston->London and Boston->Paris might show both markets ‘cost’ $.60 per mile for business class, while the coach fare was $.25 per mile. Given the same yield, the Average Ticket Prices between both cities would be higher on the longer haul market – Paris. Therefore, it’s yield that shows you quickly that you have equitable contracts – not price.

I still like Average Ticket Prices, I just don’t think they win as often.

Aviation Travel Management

Airline Ticket Prices Explained

Start with yield

Revenue yield is a terrific measurement to compare airlines, corporate travel programs, prices, cost structures, and traveler behavior. It’s widely known that two travelers on the same flight may have very different profit or loss profiles. The first passenger might generate 7¢ per mile, while the second spends over $1.00 per mile on the same flight. Still another passenger who shelled out 9¢ per mile on a long-haul in coach, might have contributed to an operating loss for the same carrier when they connected to a 200 mile flight on a regional jet that needs to generate 40¢ per mile to break even. It’s important to avoid comparing the margins against each other, but instead, travel managers and analysts should group flights by trip distance, cabin choice, advance purchase and price paid to develop skills to separate good deals from expensive ones.

Automobile financials and operating statistics are similar to airlines on a smaller scale. They provide a framework for readers who are less familiar with airline data. Edmunds.com hosts a terrific tool that allows you to determine the “True Cost to Own” any vehicle with specific options you select. This feature provides a breakdown of the factors used to calculate ownership costs including: Depreciation, Taxes and Fees, Financing, Fuel, Insurance, Maintenance and Repairs. When you know the cost over a five year period, you can divide that by the number of miles you drive to find the Cost Per Mile. Edmunds’ formula for a top seller reveals that a 2012 Camry XLE will cost about $44,000 to own for five years and drive 75,000 miles. This means the owner will spend 59¢ per mile and this yield is an apples to apples comparison to the cost to fly.

The Edmunds values make sense especially when you compare them to the IRS mileage reimbursement rate currently 55.5¢ per mile.

iStock_000011195758XSmall

Let’s expand the personal auto example and add airline-like overhead. Consider the revenue per mile Yellow Taxi generates from customers in Chicago, Illinois. They use a two-part pricing model that combines an “access fee” $3.25 for the first 1/9th mile, with 20¢ for each 1/9th mile after that (ignore the other add-ons for this). A one mile ride costs $4.85, but that drops down to $2.41 per mile by the fifth mile. We already know that 55¢ is a reasonable estimate for Yellow Taxi’s operating cost, but that excludes a taxi license, communications expenses and the driver’s wages – it’s not a stretch to imagine that a taxi company’s expenses could top $1.00 per mile and double that when you consider mileage without a passenger. Drivers and taxi permits are major expenses that dramatically increase the cost to operate a taxi company in any city and “repositioning” costs are not insignificant and analogous to airlines’ costs for terminals and flight crews. Airlines can carry passengers far below the $2.00 per mile Taxi’s need, and they do it a thousand percent faster.

A refresher about the cost of personal transportation is a great segue into the world of airline finance and passenger yields. I’ve written about Form 41 data before, here, but want to point out a few excellent resources for airline data – the Global Airline Industry Program at MIT and their Airline Data Project. Additionally, Bill Swelbar’s blog, Swelblog, houses his opinions and analysis of current industry trends. Those sites along with select annual reports provided the data for my analysis.

As fuel prices continue to have an outsized impact on airline operating expenses it’s important to understand what’s going on behind the scenes to make predictions about how prices may change in the future. I modeled an airline’s cost structure first; I’ll  describe a few assumptions through a discussion about aircraft operations that allowed me to calculate the variable and fully allocated costs of each seat mile.

Begin with a short haul flight between Boston and LaGuardia, a 186 mile flight scheduled to operate over 113 minutes – only 31 minutes in the air. The balance of that time is used to taxi, park, load and unload. Short flights are burdened with higher costs for low aircraft utilization, gate expenses, ground handling and other costs that cannot be sprayed very far when you only have 186 miles to generate revenue. A fifty seat regional jet would create 9,300 Available Seat Miles. The flight will consume more than 230 gallons of Jet A priced at $2.80 per gallon and the crew salaries and benefits will be about $437. That gives us a variable cost near 11¢ per seat mile, while adding ownership costs, maintenance expenses, landing fees and other SG&A drives the cost per available seat mile up to around 37¢ per mile. The flight needs to generate more than $3,500 to break even.

On the other end of this model: Chicago -> Hong Kong, with a three cabin Boeing 777-200 with generous cabin space and 245 passengers. Current fuel prices demand this flight generate more than $290,000 over the 7,800 miles between these two cities. The fuel expense alone is more than $100,000.

Gate time incurs agent expense and airport rent, while taxi time drives full pay for the cabin crew and burns fuel. Wheels-up time is actual flying time (high fuel burn). Block time is literally the sum of minutes the plane isn’t parked with wheel chock blocks in place. Each phase of the commercial operation has a different expense profile – the key takeaway is that flying is only a fraction of the cost. Click on the table for a detailed view.

block times

Now that you know something about the time demands based on stage length, you can combine that with expense ratios to predict how much revenue an airline must generate for each seat. Airline expenses are captured in the following categories in predictable ratios starting with fuel expenses (38% of revenue), crew costs (30%), aircraft ownership (10%), maintenance  (10%), SG&A (12% – includes airport leases, landing fees, and other selling, general and administrative). Fuel, Maintenance and Crew costs are cash expenses an airline can avoid when they reduce their schedules, but rent, leases, ownership and overhead will continue to be paid and those costs will rise in the short term as capacity declines.

Break-even Yield data is available and fare information is easy to find – they can be used to construct a simple excel model to allow “goalseek” and other “what-if” scenario tools to apply simple rules and ratios to predict fares by cabin on a few routes. In the table below Cash Cost is the direct cost of operating the trip including crew salaries and benefits and fuel; VCASM means Variable Cost Per Available Seat Mile, CASM is the fully allocated Cost Per Available Seat Mile, blended CASM is the average Cost Per Available Seat Mile and combines costs for coach and other premium cabin seats.

trip costs

Predictive pricing models

Since fuel, crews and maintenance account for 70% of airlines’ total passenger revenue (at break-even margins), a leisure fare, marketed directly, is unlikely to sell for less than the variable cost of the seat; variable costs put a floor under the model’s leisure price (consolidator’s frequently have access to fares that just cover the fuel cost). I modeled a few variables to see how this assumption holds up and to determine if a simple model could predict industry pricing.

Divide fares into Leisure, Full Y (full fare coach), then F/J (domestic first, or business class), assume Leisure fares are 150% of the variable cost of fuel and crew expenses, then full Y is 300% of the leisure fare, and First class is double the full Y fare. Those assumptions produce results that look very similar to ticket prices customers are paying. Click for detail.

trip cost assumptions

I changed the previous assumptions to take a deeper look at a three class, long haul trip. Starting with the $295,000 breakeven revenue required from passengers on a 245 seat flight to Hong Kong, I used “goalseek” to find the coach ticket price required if you assume Business Class is three times more than coach, and First Class is three times more than Business Class? The result is below.

Expected Fares by Cabin

Business Class yield stands out – it’s very low compared to what most corporations are paying. Few customers actually pay 77¢ per mile in First Class, and a number of Coach passengers have a better price than shown above – that puts the burden squarely on the shoulders of the bread-and-butter Business Class travelers to make up revenue deficits in other cabins.

This back of the envelope analysis suggests that airlines that operate two-cabin aircraft on International routes actually have enhanced pricing power vs. airlines that operate three cabins. Two-cabin aircraft can dedicate more floorspace to business class and offer all travelers a price point below their three-class competition, while generating higher average revenue. Additionally, more business class seats allow an airline greater flexibility to upgrade coach customers and eliminate expectations that business class customers will be upgraded. Furthermore many airlines use the upgrade waterfall to eliminate overbookings in Coach by closing business class before it sells out, but First remains available. They protect oversales by moving travelers from business to first, and from coach to business. This reduces their First Class revenue and creates disappointment for top-tier, premium travelers when the waterfall doesn’t work out for them.

Both models offer you a framework to bin ticket prices by distance and cabin to help you develop your own cost ratios. That information can become the basis for a deeper analysis on your travelers’ buying patterns and will help uncover ways you can change behavior to drive cost savings and negotiate with suppliers.

For more articles about airline operating costs check out: The Secret Behind Airline Fuel Surcharges.

Aviation Travel Management

Navigate Bigger Airline Discounts

At first glance there’s no secret – airlines exchange higher share for better discounts. This seems easy enough, but there are a few things going on behind the scenes that smart corporations know and will use to their advantage to secure higher savings rates. Well managed travel programs are all the same. They have strong management teams and their policies and practices are aligned with business goals and traveler service. They generate “duty of Loyalty” – employees are driven to comply with policies because they receive excellent service; their travel management team is partnered with them to achieve each travelers business goals.

Airline customers come in all shapes and sizes, but a single number cannot tell the whole story. Airlines capture a lot of data, but four numbers standout to describe a customer: 1. Yield (average revenue per seat mile); 2.  Premium share (Percent of revenue above (below), the carriers fair market share (FMS)); 3. Total spend (revenue to airlines); 4. Customer concentration (Percent of traffic in markets the airline serves). This article will offer a simple scoring system corporate customers can use to determine how much leverage they may have in negotiations with their preferred airline suppliers.

Good airlines create detailed reports to measure the health and profitability of their corporate contracts. Major network carriers have 1,500 – 4,500 managed contracts in place, with another 5,000 – 30,000 agreements serviced through corporate loyalty programs (American – Business ExtrAA, United – PerksPlus, Delta – SkyBonus , Southwest – SWAbiz). Airlines would keep a close eye on trends that correlate the Net Effective Discount rates (NER) to the Yield and Revenue of a particular client. A rational and financially savvy sales team drives profitability higher by controlling NER’s  across industries or clients with similar spend patterns and size. Outliers are analyzed to determine if a particular team or sales person offered higher discounts than necessary to secure preferred carrier status. Additionally, sales support and analysis teams pay attention to specific customer issues.

As an example two consumer packaged goods companies have similar travel policies and total spend might, but warrant different discount levels based on their travelers’ compliance and support for their preferred carriers. Travel managers in the same industry would be disappointed if they expect equal treatment and ignore differences beyond size and policy compliance.

Airlines use sophisticated modeling and regression analysis to determine if their programs are working as designed. They produce graphs similar to the one below to share internally and use as a framework for strategy discussions about discounts and commissions.

Yield V Revenue

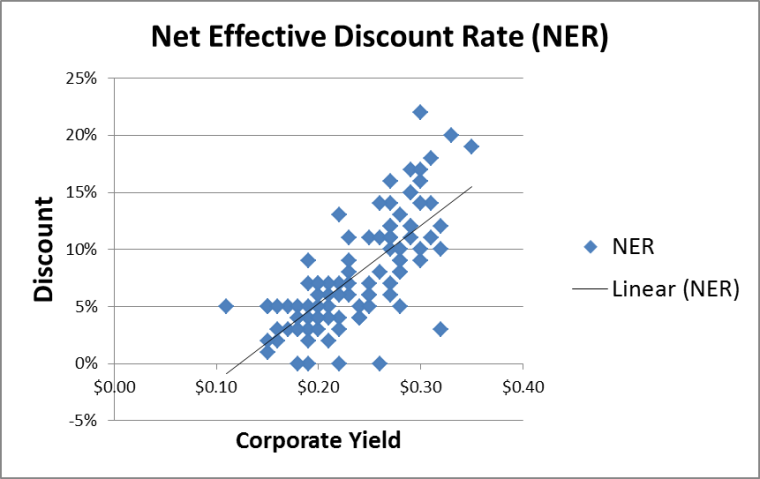
A simple scatter plot that contains data for the carrier’s top 100 clients might look like the graph above. The point on the far right depicts a corporate client that produced $35M, at a $.25 yield. It’s a large customer, but not an extraordinarily high yield. Notice there are several customers at or just above a $.10 yield. They are unlikley to receive industry leading discounts, but these customers can take steps to secure better discounts.

In the next graph the airline’s management team would look for a low slope angle and points clustered around the best-fit line. The slope indicates the relationship between yield and the customers’ discount levels. The lower the slope, the less sensitive to discounts higher yields are, while a high slope indicates that as yield rises, discounts are likely to increase rapidly too. Again, this is sample data, but it should give you an idea about how your program is viewed by your preferred vendors.  Additionally corporations without a contract should be able to achieve a savings rate at least as high as available through a loyalty program, so I’m always amazed to see NER’s below the 5% line (a typical valuation for SkyBonus or Business ExtrAA).

NER

Travel Managers should evaluate their program’s performance to establish realistic goals as they position their company and their Travel Management partner to launch an airline RFP. At this point, trust and respect between your team and the account managers and sales people at each supplier are vital for a smooth negotiation, but an honest appraisal can jumpstart the process and show you areas where your suppliers may expect work on your side to achieve your RFP goals.

Travel Managers who understand the airlines point of view and have strong influence over the qualities that matter will be rewarded.

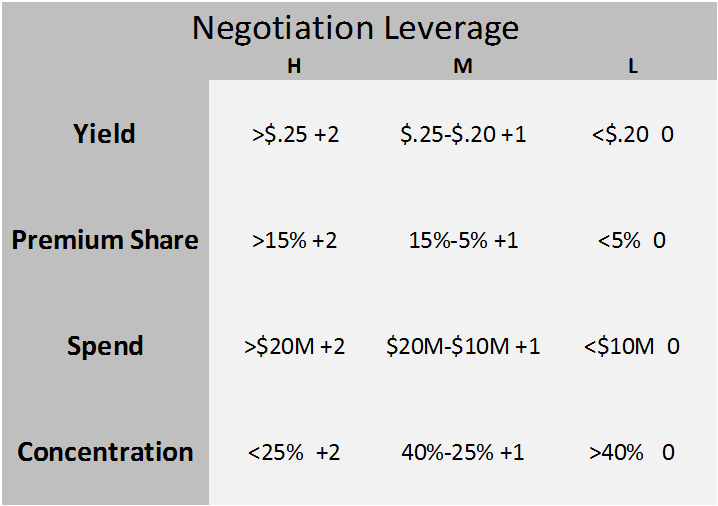
Here’s a model I developed to determine how much leverage you have as you begin the negotiation process.

Leverage

Yield: Begin here. More than $.25 give your program two points. You have a travel policy that likely includes a healthy combination of domestic first class, some International flights (in business class), and a decent percentage of domestic coach-class, business fares. If you achieved this primarily because your headquarters office is in Boston, and your team flies to New York, Laguardia on the shuttle, exclude that data for this exercise. And for those companies that have a combined yield below $.20, don’t try too hard with the airlines, you’re already doing a great job – your travelers buy coach, and they book at least seven days out (no points). Everybody else, between $.20 – $.25 give yourself one point.

Premium Share: This is the one that separates well-managed programs from also rans. Does your travel team have the ability to influence travelers vendor choices? If you can answer yes – you have leverage. Do you enforce contracts to do the heavy lifting or do you need constant support from vendors each time a traveler finds a lower fare online or a checked-bag disappeared? Honesty here will uncover opportunities to drive incremental savings, but more of the same if the same means high maintenance then you will have a difficult negotiation. If you’re a bank or a movie studio and you give one of the legacy carriers an unbelievable share above their Fair Share or Seat Share in the LAX<>JFK market, then you get two points. If you’re based in Atlanta Delta earns all of your business, don’t get too excited, but I would still give you two points here (we’ll address this more in Concentration). For everyone else, use your judgement.

Spend: Are you a big hitter? Does your company spend more than $1BN each year on air travel (you know who you are), than give yourself two points – you’re big enough to dictate some terms. Even if you spend >$25MM and you have a well-managed program you’re likely to have more leverage than a smaller program.

Concentration: This one is more subjective than the others, but if more than half your spend originates or ends in a fortress hub, you should score yourself lower. A company with operations in New York, Los Angeles, Chicago, or any number of up-for-grabs cities will find that this will give you leverage to negotiate better terms with your vendors.

Leverage Scale

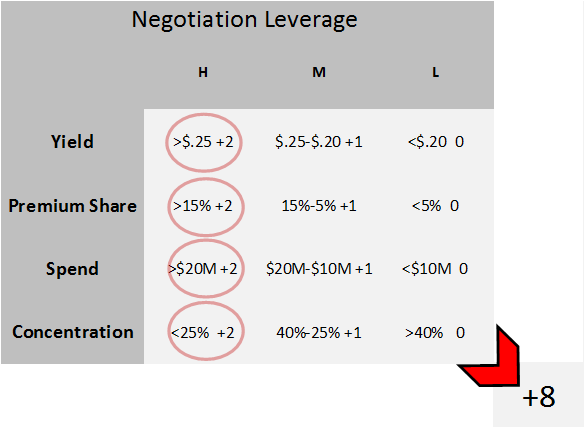
Here’s an example – If you combine low concentration, high premium share and high yield you will find yourself in a rare position and should expect industry leading discounts – even if you have a relatively low spend ($5MM). Carriers should fight over this business and the winners would expect to receive profitable traffic.

Leverage Score

The graph above depicts the best customer – one that can dictate terms and may be able to include “most favored” status in parts of their contracts. Any score above five would put a corporation in an excellent position as they negotiate with vendors. Four or below leaves room for improvement, but you should distinguish between values you can control and those you cannot. Total spend is something you’re unlikley to have influence over, but premium share is.

Travel Managers have a significant influence over the premium share variable, and travel policies are yield’s biggest drivers. Before any negotiation you should determine which avenue for savings would be more effective a policy change or carrier discounts. Remember four constituents should be delighted at the end of the process: travelers, corporations, airlines, and travel management partners.

Aviation Travel Management

Strategic Travel Managers Know Chemistry

Imagine a dashboard that could show you how much carbon dioxide your travelers generate every day. It’s actually a straight-forward problem and one I’ll try to solve for you today. Information about aviation fuel economy isn’t very accessible, but there are good clues and accurate data is easy to capture. Your frequent flyer account will keep track of the miles you’ve flown, but it’s impossible for most people to connect the dots to determine what their trips cost. Not in dollars, but in fuel, or in CO2 emissions. In a previous article I calculated “mileage” rates for aircraft by cabin and type of plane (single aisle or twin aisle) “The Secret Behind Airline Fuel Surcharges.”

In this report I’ll show you how much Carbon Dioxide a particular flight created and give you a quick, easy-to-use grid to provide travelers with information about the carbon footprint their choices make.

No need to remember anything about High School chemistry since I’ll lay out the chemistry and math to solve this problem.

First, Jet Fuel, or Jet A, contains a blend of different carbon-based molecules that combine with Oxygen to generate heat and pressure that jet engines convert to thrust. For simplicity, I’ll ignore the blend, and assume that “Octane”, a string-like molecule that contains a backbone with eight carbon atoms, and eighteen Hydrogen atoms along the sides and endcaps, is a good proxy for everything else in the gas tank. During the combustion reaction, each carbon atom combines with two Oxygen atoms to form Carbon Dioxide (CO2), while Hydrogen will also combine with Oxygen, but their marriage yields water (H20). The reaction balances when two Octane molecules react with twenty-five Oxygen molecules (O2) which contain two Oxygen atoms captured from the air passing through the engine. The exhaust product contains sixteen Carbon Dioxide molecules and eighteen water molecules. Here’s the equation: 2 C8H18 + 25 O2 -> 16 CO2 +18 H20.

This detail isn’t useful until we convert molecular weights and ratios into terms that people are more familiar with. In this case, jet fuel weighs about 6.5lbs per gallon, and that mass is 81% carbon. We already know that our Octane molecule will split to form water and CO2, but the result most people struggle with is the conversion to weight. Specifically, Oxygen is heavy, about a third heavier than Carbon, so when each Carbon atom combines with two Oxygen atoms, the resulting molecule, CO2 is four times heavier than the Carbon atom by itself. This means each gallon of jet fuel (6.5lbs) carried by the aircraft will combine with 23lbs of Oxygen from the air during the journey and turn into twenty pounds of CO2, and just over nine pounds of water!

How much CO2 does a Boeing 777-200 create on a flight between Chicago and Hong Kong? Let’s work through it – fuel is a liquid, and measured in gallons, but the exhaust is a gas, that’s why we use weight rather than volume to describe the output. I calculated the 777-200’s gas mileage in a previous post here. At .1836 miles per gallon, a 7,821 mile flight needs 42,000 gallons. The flight would generate 851,000lbs of CO2. That’s 30% more than the maximum takeoff weight on departure, including the plane, fuel, passengers and cargo. The table below contains a comparison among cabins and shows passengers, fuel burn and CO2 emissions.

CO2 per flight

Now that you have information about how to calculate the CO2 emissions for an entire flight, we need to add more information to break this down to the seat level. Previously I calculated the fuel burn per seat to provide a table that shows how much the fuel costs per mile for each cabin and at various price points for fuel. That’s a good starting point, but this time the data table will display how much CO2 an international flight would create for different distances and cabin. See below.

C02 per seat 777-200

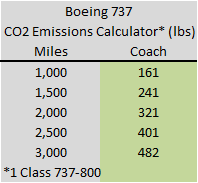
The Boeing 777-200 offers a useful snapshot of the likely performance other aircraft could achieve. It’s a good benchmark because it’s currently in production and it’s flown on transatlantic, transpacific and intra-Asia flights.  However, the design requirements for long-haul international flying require twin aisles, more lavatories, large galleys, more storage space, life rafts and a host of other overhead not needed for shorter hops. These factors make it useful to perform a similar calculation to offer information about CO2 production from more efficient single aisle aircraft in use on short hauls and for domestic US flying. In this case, the 189 seat, all coach, 737-800.

CO2 per flight 737

A comparison between the 737 and 777 coach emissions level demonstrate that the smaller aircraft is more than 55% more fuel efficient when using numbers normalized for total seats. When you measure efficiency on a blended basis across all cabins the total difference is higher, that’s why it’s important to have separate tables. These tables offer you a quick resource to answer questions about the carbon footprint your travelers leave behind each trip. For more information about aircraft efficiency and comparisons among different modes of transportation, check out these posts about commercial aircraft fuel economy:

The Secret Behind Airline Fuel Surcharges

Boeing 737 vs. Toyota Prius (this might surprise you)

Aviation Travel Management