
Several years ago I was trying to master cross-wind landings in an especially under-powered airplane on a gusty springtime day in North Texas. It was ugly. I was all over the runway – at one point even touching down with the nose pointed 30 degrees to the left of an enormous strip of concrete at Alliance Airport. I was frustrated and exhausted when my flight instructor broke in with encouragement I’ve found useful many times since. He said, “It’s your pony to ride.” He meant own it, make the plane do what you want it to do, when you want it to do it. Don’t let the wind knock you around – be the boss. Said another way, when in charge, take charge, and when you’re not, act as if you are. That’s great advice for anything you do – and it applies to leadership and self-improvement.
Have you ever tried to measure how much you’ve learned since your last graduation? Did the internet exist? Smart phones? Twitter, Linkedin, Salesforce.com, 3D printers, LEDs, SAP, Prezi, Dropbox, Office, Word, Excel, and all the other technology tools, gadgets and Software as a Service applications you’ve mastered? What have you learned about managing people, HR rules, federal regulations, tax laws, environmental regulations, and everything else you’ve focused on? I’ll bet your working knowledge has increased at least 3% every year – if not more, and many skills seem to multiply the benefits of newer skills and information. There’s a cumulative effect. But what does that look like, and how would it impact you to find ways to be more efficient and to adopt new technology or processes before your peers? I’ll show you after a brief discussion about success.
High School reunions provide lots of material about how we predict and measure success. Yours and others. When you graduated it’s likely that you had an idea about how successful or unsuccessful your classmates would be. In most cases you had little information about your peers’ personal growth strategies so it was difficult to predict that the “C” student in your social studies class, the one who spent summers roofing new homes, would go on to own a $100 Million construction company, or the quiet kid in your English class would earn a law degree from Yale and end up as a Federal Judge. In High School, and beyond college, it’s too early to observe the cumulative effects of exponential growth. Over time skills and knowledge acquired outside the classroom will dominate. It can take many years to rack up the score that other people use to measure progress. Successful people share a drive to learn new things and take risks. And many learn that failure doesn’t stop you unless you let it. Everyone fails, but some people keep trying.
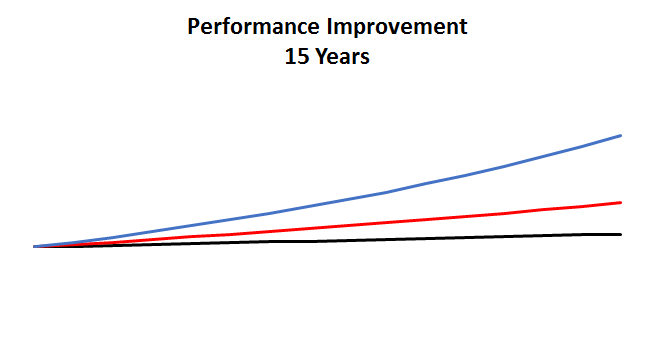
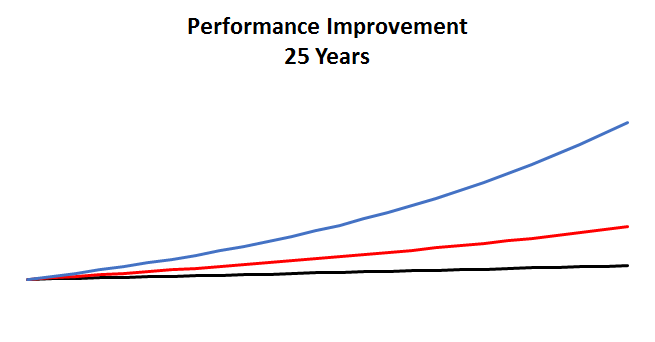
It doesn’t matter what you measure, income, wealth, efficiency, knowledge, employees – pick your yardstick. Comparisons among three exponential growth rates 1%, 3%, and 6% lead to obvious difference over several years. A 6% improvement starts to bend up and away from the 3% line. Separation is evident over fifteen years, but the “Bend” is clear over twenty-five years.
Again, It doesn’t matter what you measure, what counts is that learning something new provides enormous benefits over many years. Look at the same graph over thirty years – the 6% line bends upward in an increasingly obvious way. But what if there were opportunities for giant leaps? A promotion, a degree, a company started, a skill mastered? How would leaps impact the line for a life-long learner?

In the next chart two 50% leaps have been added to the 6% line in early years. Maybe the leaps were generated by an advanced degree, but what if they flowed from starting a business that failed, or a second business that failed? You would be far smarter and wealthier from the experience. It doesn’t matter how your axis is labeled, the point is to see how gains can have a huge impact over years.

Obviously leaps have an enormous impact – especially when they occur early – but leaps create bends any time they happen – and that’s what you need to know to develop a plan that will separate you from the crowd. A final example – what happens to someone who catches a lucky break or a gets an unexpected promotion, while avoiding new skills or knowledge? Take a look.
 A 1% annual improvement with a 50% leap in year 12, climbs past the steady 3%-er, but the effect isn’t long-lived, and slow and steady outperforms. This begins to look like a study in luck – or the idea that lucky people make themselves lucky. You’ve already seen how much separation occurs when the 6%-er received the lucky break – was that person lucky? or did they create the situation? Undoubtedly these charts demonstrate that meaningful progress to develop new skills can lead to big performance differences. Get a plan and start something to bend your line.
